** Support and distribution of this app will be discontinued as of October 4, 2017 **
** A new app "Solar-Log WEB Enerest™" is available free of charge for you **
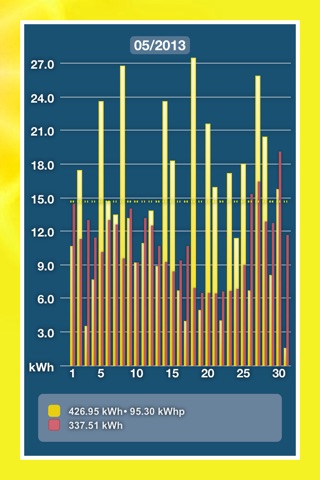
The Solar-Log™ APP visualizes the yield data of a PV plant and displays the data on the iOS device graphically. Daily data and historical data are displayed in the form of Daily, Monthly, Yearly and Total overviews. In addition to this, the plant’s saved CO2 values, total power consumption and own consumption are visualized. The intuitive operation by means of swipes allow for fast navigation between the individual time spans. Multiple, differing PV plants can be monitored with the Solar-Log™ and visualized by the APP. The PV plants installed, together with their current data, provide an insight into the capabilities of modern PV plants. The APP stores all data in an internal cache to make it possible to view the stored data even without an Internet connection. The "Slideshow" mode makes it possible to display the plant permanently. Thus it is possible to see the plant performance at a glance.
All plants are possible to visualize on the APP that are active on one of our two Internet platforms: Solar-Log™ WEB "Commercial Edition" as well as Solar-Log™ WEB "Classic 2nd Edition".

